

 |
Please type your LAST NAME and LAST FOUR SS# digits (eg: Smith3256):
I received no help from anyone on this assignment.

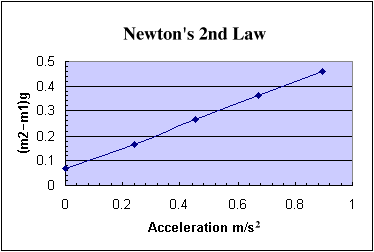
2. The graph represents the data obtained from the experiment as described in the handout.
a. What is the slope of the line and what physical quantity (with units) does it represent?
b. What is the y intercept, what physical quantity (with units) does it represent and why is it not zero?
You may change your mind as often as you wish. When you are satisfied with your responses click the SUBMIT button.